Datoteka:Bifurcation.gif

Veličina ovog prikaza: 800 × 366 piksela. Ostale razlučivosti: 320 × 146 piksela | 640 × 293 piksela | 1.024 × 469 piksela | 1.280 × 586 piksela | 2.312 × 1.058 piksela.
Vidi sliku u punoj veličini (2.312 × 1.058 piksela, veličina datoteke: 139 KB, MIME tip: image/gif)
| Ova je datoteka sa Zajedničkog poslužitelja i mogu je rabiti drugi projekti. Opis s njezine stranice s opisom datoteke prikazan je ispod. |
Sažetak
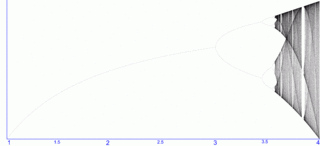
| Opis | Bifurcation diagram for population equation . The horizontal axis represents the r factor (from 1 to 4) - control parameter, and the vertical axis represents the x variable (0 to 1) - population (as a percentage) for each n between 2000 and 2500. |
| Datum | |
| Izvor | Own work - made with Visual Basic |
| Autor | Me (Stevo-88) |
| Dopuštenje (Naknadna uporaba ove datoteke) |
Everyone, do everything you want with this! :) |
| Ostale inačice | For full-sized version of this file, check it's history before 2nd August 2007. It has been scaled down due to thumbnail-making problem (caused by its size). |


|
This image is an information graphic created by a computer program from data sets or formulas that have not been fully provided on this page. In order to allow other editors to improve or build such images, and to ensure compliance with free content licenses such as the GFDL, the following should be provided:
|
|
| |
Licencija
| Ja, nositelj autorskog prava za ovo djelo, prepuštam ovo djelo u javno vlasništvo. Ovo prepuštanje vrijedi za cijeli svijet. U nekim državama to nije pravno moguće; ako je tako: Dajem svima prava da koriste ovo djelo za bilo koju svrhu, bez ikakvih uvjeta, osim ako takvi uvjeti nisu propisani zakonom. |
Povijest datoteke
Kliknite na datum/vrijeme kako biste vidjeli datoteku kakva je tada bila.
| Datum/Vrijeme | Minijatura | Dimenzije | Suradnik | Komentar | |
|---|---|---|---|---|---|
| sadašnja | 18:25, 2. kolovoza 2007. | | 2.312 × 1.058 (139 KB) | Stevo-88 | == Summary == {{Information |Description=Bifurcation diagram for population equation <math>x_{n+1}=rx_n(1-x_n)\,</math>. The horizontal axis represents the r factor (from 1 to 4) - control parameter, and the vertical axis represents the x variable (0 to 1 |
| 14:16, 10. veljače 2007. |  | 9.048 × 4.032 (597 KB) | Stevo-88 | == Summary == {{Information |Description=Bifurcation diagram for population equation <math>x_{n+1}=rx_n(1-x_n)\,</math>. The horizontal axis represents the r factor (from 1 to 4) - control parameter, and the vertical axis represents the x variable (0 to 1 | |
| 22:26, 6. veljače 2007. |  | 9.048 × 4.032 (597 KB) | Stevo-88 | {{Information |Description=Schroeder's stairs, a type of optical illusion. |Source=Own work - my representation of a well known optical illusion |Date=25 November 2006 |Author=Me (Stevo-88) |Permission=Everyone, do everything you want wi |
Uporaba datoteke
Na ovu sliku vode poveznice sa sljedećih stranica:
Globalna uporaba datoteke
Sljedeći wikiji rabe ovu datoteku:
- Uporaba na fr.wikiversity.org
- Uporaba na sh.wikipedia.org