Datoteka:DT fusion rxnrate.svg

Veličina ovog PNG prikaza ove SVG datoteke: 360 × 324 piksela. Ostale razlučivosti: 267 × 240 piksela | 533 × 480 piksela | 853 × 768 piksela | 1.138 × 1.024 piksela | 2.276 × 2.048 piksela.
Vidi sliku u punoj veličini (SVG datoteka, nominalno 360 × 324 piksela, veličina datoteke: 12 KB)
| Ova je datoteka sa Zajedničkog poslužitelja i mogu je rabiti drugi projekti. Opis s njezine stranice s opisom datoteke prikazan je ispod. |
Sažetak
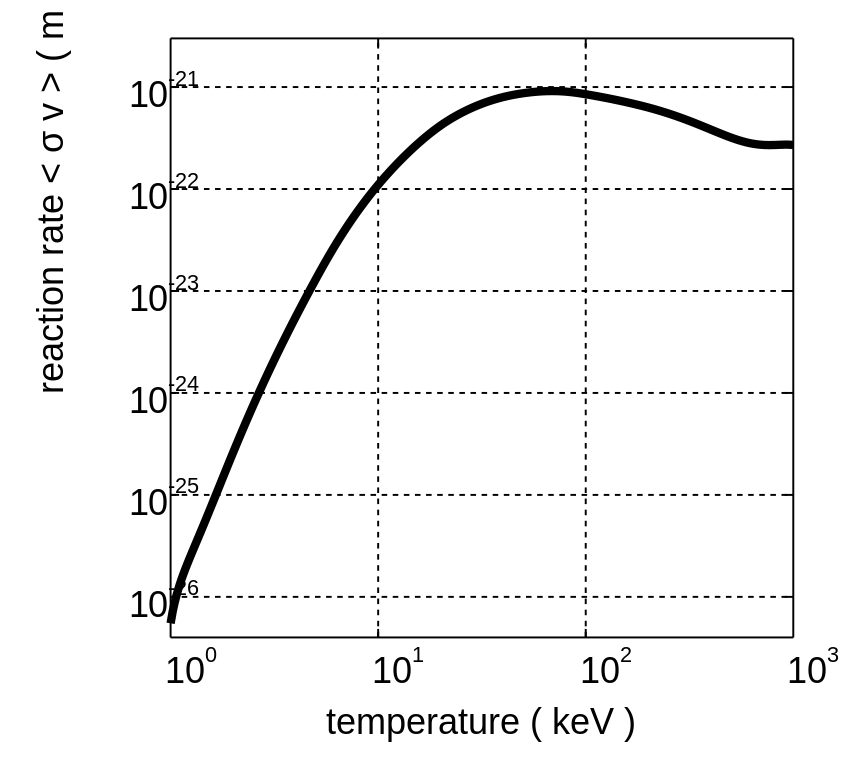
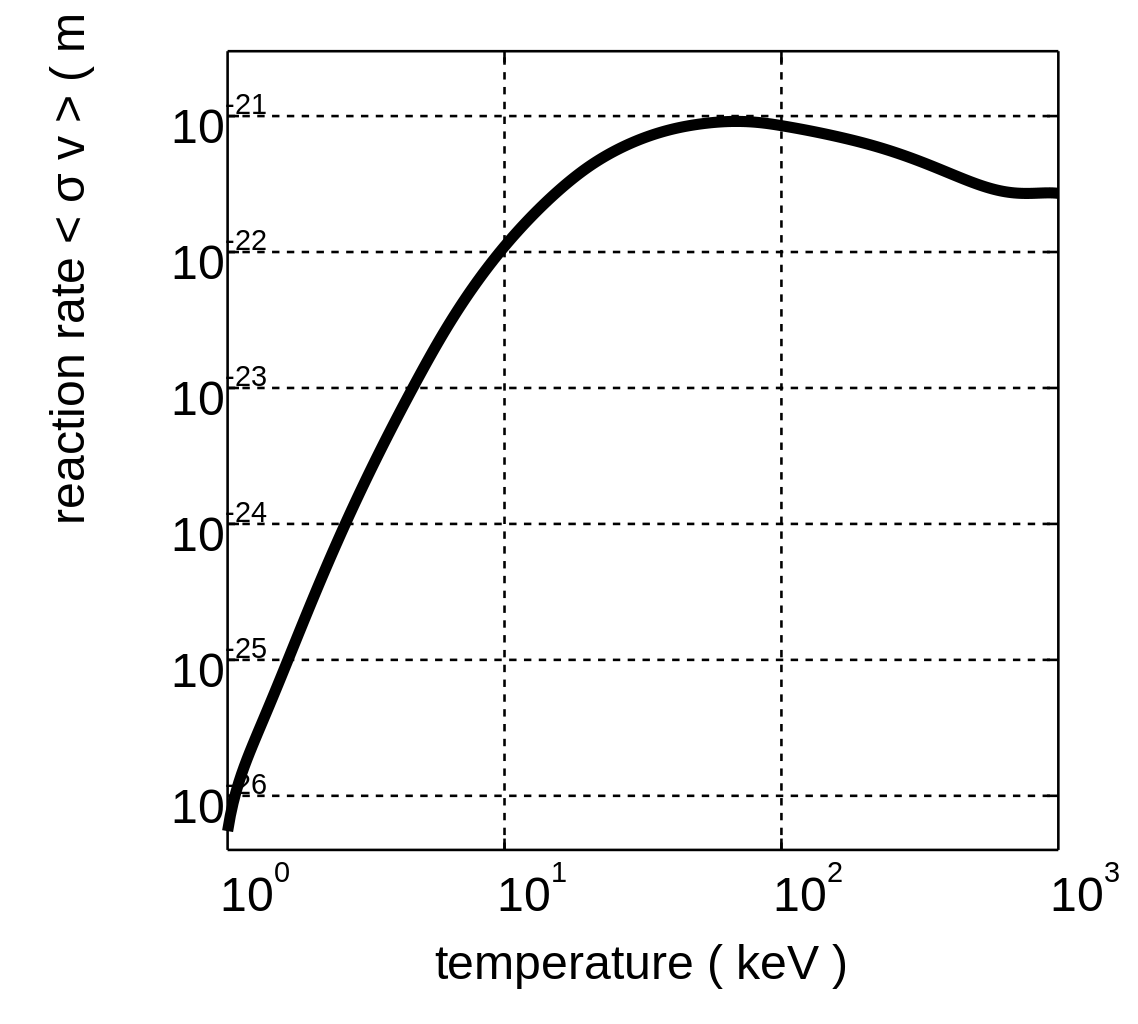
Logarithmic plot of the deuteron-triton fusion reaction rate <σv>, for Maxwellian ion velocity distributions with the same temperature. Created on 10 December 2005 by David Strozzi using Matlab. The curve is a spline interpolation through the data points included on p. 45 of the 2000 revision of the "NRL Plasma Formulary."
Licencija
Ova datoteka je licencirana pod Creative Commons Imenovanje-Dijeli pod istim uvjetima 2.5 nelokaliziranom licencijom.
- Slobodno smijete:
- dijeliti – umnožavati, distribuirati i javnosti priopćavati djelo
- remiksirati – prerađivati djelo
- Pod sljedećim uvjetima:
- imenovanje autora – Morate pripisati odgovarajuće autorske zasluge, dati poveznicu na licenciju, te naznačiti jesu li načinjene promjene autorskog djela. Prethodno navedeno možete učiniti na svaki razuman način, ali ne na način koji bi sugerirao da Vi ili Vaše korištenje licencorova djela ima izravno licencorovo odobrenje.
- dijeli pod istim uvjetima – Ako ovo djelo izmijenite, preoblikujete ili stvarate na osnovu tog materijala, svoje doprinose morate distribuirati pod istom ili kompatibilnom licencijom kao što je i licencija originala.
Povijest datoteke
Kliknite na datum/vrijeme kako biste vidjeli datoteku kakva je tada bila.
| Datum/Vrijeme | Minijatura | Dimenzije | Suradnik | Komentar | |
|---|---|---|---|---|---|
| sadašnja | 02:15, 12. prosinca 2005. | | 360 × 324 (12 KB) | Dstrozzi~commonswiki | Logarithmic plot of the deuteron-triton fusion reaction rate <σv>, for Maxwellian ion velocity distributions with the same temperature. Created on 11 December 2005 by David Strozzi using Matlab. The curve is a spline interpolation through the data |
| 00:01, 11. prosinca 2005. |  | 270 × 234 (12 KB) | Dstrozzi~commonswiki | Logarithmic plot of the deuteron-triton fusion reaction rate <σv>, for Maxwellian ion velocity distributions with the same temperature. Created on 10 December 2005 by David Strozzi using Matlab. The curve is a spline interpolation through the data | |
| 22:19, 10. prosinca 2005. | 270 × 3 (12 KB) | Dstrozzi~commonswiki | Logarithmic plot of the deuteron-triton fusion reaction rate <σv>, for Maxwellian ion velocity distributions with the same temperature. Created on 10 December 2005 by David Strozzi using Matlab. The curve is a spline interpolation through the data | ||
| 21:52, 10. prosinca 2005. | 270 × 3 (12 KB) | Dstrozzi~commonswiki | Logarithmic plot of the deuteron-triton fusion reaction rate <σv>, for Maxwellian ion velocity distributions with the same temperature. Created on 10 December 2005 by David Strozzi using Matlab. The curve is a spline interpolation through the data | ||
| 09:24, 10. prosinca 2005. |  | 512 × 333 (12 KB) | Dstrozzi~commonswiki | Logarithmic plot of the deuteron-triton fusion reaction rate <v>, for Maxwellian ion velocity distributions with the same temperature. Created on 9 December 2005 by David Strozzi using Matlab. The curve is a spline interpolation through the data points i |
Uporaba datoteke
Na ovu sliku vode poveznice sa sljedećih stranica:
Globalna uporaba datoteke
Sljedeći wikiji rabe ovu datoteku:
- Uporaba na bs.wikipedia.org
- Uporaba na eo.wikipedia.org
- Uporaba na es.wikipedia.org
- Uporaba na fr.wikibooks.org
- Uporaba na ko.wikipedia.org
- Uporaba na no.wikipedia.org
- Uporaba na pt.wikipedia.org
- Uporaba na sh.wikipedia.org
- Uporaba na sr.wikipedia.org